What a jarring dose of reality when I dove into Visual Studio 2010 a couple years ago. It's plagued by 20-year-old defects that were annoying then but unacceptable and ridiculous now. Microsoft also introduced embarrassing UI regressions that cripple the app in new ways.
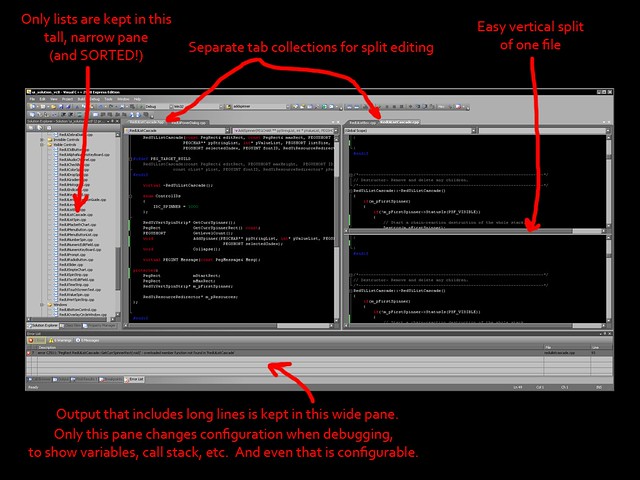
First, the good. The UI's organization is pretty decent, much better than Xcode's:
I started taking notes about the bad. Here they are.
- The scroll wheel doesn't work in the pane that the cursor is hovering over. You have to click everywhere to activate every pane on the screen. Why should I have to click in the variables pane just to look at a variable?
- A similar focus problem: The drop-down function list retains focus after you select a function, so if you try to scroll your document with the wheel, you're instead scrolling the values inside the (now collapsed) function drop-down.
- Massive color problems make text invisible in many parts of the interface.

- Project-property dialog is still not resizable, and yet it's full of typically long strings and settings. This retardation plagued Visual C++ two decades ago. Inexcusable.
- The drop-down function list still doesn't list all functions in the file; it's limited to the object in which the insertion point is sitting . Or you have to select an object scope from the left drop-down, going through them one at a time, if you don't know which one contains the function you're looking for. Why isn't there an "entire file" scope offered? And why does it continually pick "global scope" by default, when that scope is empty and there's only one scope defined in the file?
- Doesn't do syntax completion on symbols. You have to type out every class and variable name, every time.
- Syntax completion doesn't work if you position the cursor after a period or arrow in member notation and start typing. You have to erase the last character in the symbol and retype it to restart the syntax completion.
- printf statements don't write to the Output window! And the clumsy alternative, OutputDebugString, doesn't take printf-style formatting and insists on wide characters. OutputDebugStringA doesn't require wide characters, but was essentially undocumented; someone in the comments claims it's now documented.
- Paths are recorded as absolute, and not relative, when when you navigate to them to set project properties such as the working directory for debugging. So of course the project is broken for anyone trying to use it on a different computer.
- If you right-click on a file in the left pane and view its properties, you can't see its path. You have to go two levels deep into the View menu to bring up a whole separate Properties window, which finally shows the path.
- Matching braces or parentheses are only highlighted when you first type them, and then never again. They aren't highlighted when the insertion point crosses them.
- There's a "Go to header file" function, but no "Go to implementation file" counterpart. Also, "Go to header" doesn't appear to work if the header's extension is "hpp".
- There's no way to reveal the file you're editing in Explorer. You can't see the path of the file anywhere either, even if you hunt through the view menu and show the obscure "Properties window". The Properties window goes BLANK if you put the cursor in the editor.
- Context menu won't let you search for definitions of symbols in that appear in comments.
- Error lines aren't highlighted in code when you double-click an error in the output or error list. Instead, a tiny blue sliver appears in the gutter next to the line, which you have to hunt for. The color settings for "compiler error" are ignored, and you can't set the background color there anyway.
- The drop-down function list in the editor will frequently behave as though the function is missing from the source file, and instead jump to the header file; despite the fact that the function IS implemented and compiles just fine.
- The option to show line numbers is not in the View menu. It's buried under Tools / Options / Text Editor.
- When you disable a breakpoint, it simply disappears from the left gutter, and to re-enable it you have to pull up the list of all breakpoints and hunt for it.
- If you have two vertical tab groups open and select "Close all but this" on one of the tabs in ONE of the groups, it closes the tabs in the other group too.
- If you press F12 while debugging, it interrupts the program you're debugging, and there's no way to stop this. F12 is not documented as being mapped anywhere in the VS UI. So if your application uses F12 for something and you need to debug it, you're screwed. (documented: http://connect.microsoft.com/VisualStudio/feedback/details/106201/f12-stops-execution-while-debugging-and-sometimes-kills-windows)
- The menu option "Stop outlining" only works on the current file, so you have to turn this annoying "feature" off again and again. WTF.
- Double-clicking on whitespace to select it doesn't work if the whitespace is only one character (like a tab).
